Posts

Showing posts from July, 2024

2nd quarter GDP; June’s income and outlays, durable goods, new and existing home sales

The key economic releases of the past week were the 1st, or advance estimate of 2nd quarter GDP and the June report on Personal Income and Spending , both from the Bureau of Economic Analysis…other widely watched releases included the June advance report on durable goods and the June report on new home sales , both from the Census bureau, and the June report on existing home sales from the National Association of Realtors (NAR)…. in addition, the week also saw the release of the Chicago Fed National Activity Index (CFNAI) for J une, a weighted composite index of 85 different economic metrics, which came in at +0.05 in June, down from a upwardly revised +0.23 in May, in an index where any positive reading indicates economic activity has been above the historical trend…that left the widely watched 3 month average of the index at –0.01 in June, up from -0.08 in May, indicating that national economic activity has continued to average near, but just slightly below the historical trend ov...
June’s retail sales, industrial production, and new housing starts: May’s business inventories

Image
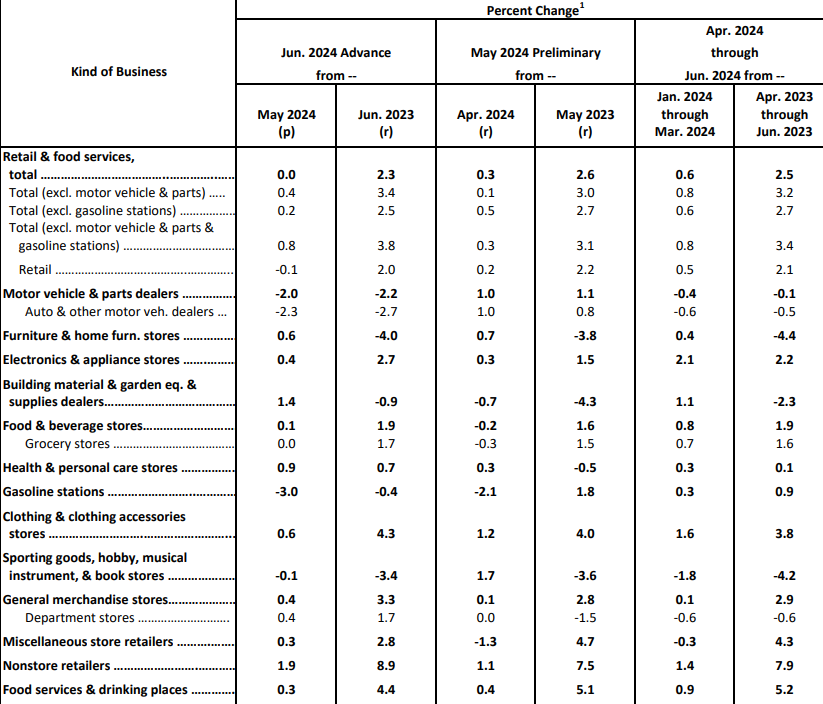
Major reports that were released this week included the Retail Sales Report for June , the June report on New Residential Construction and the Business Sales and Inventories Report for May , all from the Census Bureau, and the June report on Industrial Production and Capacity Utilization from the Fed…in addition, the week also saw the release of the Regional and State Employment and Unemployment Report for June , a report from the Bureau of Labor Statistics which breaks down the two employment surveys from the monthly national jobs report by state and region….while the text of this report provides a useful summary of this data, the serious statistics aggregation can be found in the tables linked at the end of the report, where one can find the civilian labor force data and the change in payrolls by industry for each of the 50 states, the District of Columbia, Puerto Rico, and the Virgin Islands… This week also saw the release of the first two Fed regional manufacturing reports for ...

June’s consumer and producer price indices, May’s wholesale sales

Major reports that were released this week included the June Consumer Price Index and the June Producer Price Index from the Bureau of Labor Statistics, and the May report on Wholesale Trade, Sales and Inventories from the Census Bureau…this week also saw the Consumer Credit Report for May from the Fed, which indicated that non-real estate consumer borrowing outstanding grew by a seasonally adjusted $11.3 billion, or at a 2.7% annual rate, as non-revolving credit grew at a 1.4% rate to $3,719.6 billion, while revolving credit outstanding grew at a 6.3% rate to $1,345.1 billion… A major private report released last week that i neglected to mention was the Mortgage Monitor for May , which now comes from the Mortgage Technology unit of ICE, after originating with Lender Processing Services and being published by Black Knight Financial Services for several years…what they call the “July Mortgage Monitor” indicated that 3.04% of mortgages were delinquent in May, down from the 3.31% th...

June’s jobs report; May’s trade deficit, construction spending, factory inventories, and JOLTS

This week’s major agency issued economic releases included the Employment Situation Summary for June and the Job Openings and Labor Turnover Survey (JOLTS) for May, both from the Bureau of Labor Statistics, and three May reports that will input ​data into 2nd quarter GDP: the BEA’s report on our International Trade for May , and the May report on Construction Spending and the Full Report on Manufacturers’ Shipments, Inventories and Orders for May , both from the Census Bureau… Privately issued reports released this week included the ADP Employment Report for June , the light vehicle sales report for June from Wards Automotive, which is the source data for the BEA report and which estimated that vehicles sold at a 15.29 million seasonally adjusted annual rate in June, down from the 15.90 million annual rate in May, and down from the 15.58 million annual rate in June of 2023, (NB: an annualized 600,000 in car sales were lost due to a cyberattack), and both of the widely followed pu...